

I am using this page to do a web performance testing. This page consists a typical amount of web resources as analyzed on HttpArchive.org. It is a bit challenge to set up a single test page to have all the characteristics that a typical page has as showed on Stats page. The total transfer size is about 1.5MB, and the total number of requests is about 90. So far this page has 1.1 MB data compressed, and the number of request is just about 60 (including all the indirect requests -- request from those social plug-ins.).
I am using the median values instead of average. I think they are more representative than the average values. I obtain the recent values of those stats from HTTPArive data by running a BigQuery as the following:
SELECT
ROUND(NTH(50, quantiles(bytesTotal,101)) / 1024) total,
ROUND(NTH(50, quantiles(bytesHtml,101)) / 1024) html,
ROUND(NTH(50, quantiles(bytesJS,101)) / 1024) JS,
ROUND(NTH(50, quantiles(bytesCSS,101)) / 1024) CSS,
ROUND(NTH(50, quantiles(bytesImg,101)) / 1024) Img,
ROUND(NTH(50, quantiles(bytesFont,101)) / 1024) Font,
ROUND(NTH(50, quantiles(bytesJson,101)) / 1024) Json,
ROUND(NTH(50, quantiles(bytesFlash,101)) / 1024) Flash,
ROUND(NTH(50, quantiles(bytesOther,101)) / 1024) Other
FROM [httparchive:runs.2013_08_15_pages];
Compare the above two charts of two versions this same page: one is without social plugins, the other is with social plugins. The bytes of CSS and images do not chage much, but the bytes of HTML is about 50KB more, and the JavaScript is about 150KB more.
At the bottom of this page, I draw a waterfall chart of the requests. However, this is only available for IE9+ and Chrome users. The chart is drawn using D3.
Although this page is to test the performance of web browsers, but itself is not design with the best practice. I am simply creating a web page in an amateur way. If this page goes well, I will try to optimize it so that I can compare it.
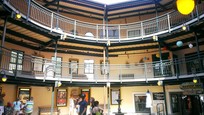
This page is not about photos, but I need pictures to fill the spaces. Pictures are important component of web pages. They count more than half of the downloaded resources of a typical web page. Here I show a few pictures that I took.
Responsive web design (RWD) has been a hot topic recently (or, old enough but just because I notice it recently). I uses @media to resize the image on mobile devices.
@media only screen and (max-width :480px) {
img.original {
  width: 100%;
  height: auto;
}


